Professor of Economics
Karnatak University, Dharwad

The year 2047 marks the centenary year of India’s independence. The Government of India has set out an ambitious vision, named Viksit Bharat or Developed India, to elevate the country to the status of a developed country by 2047. A developed country, or an advanced/industrial economy, is characterized by high level of economic prosperity, technological advancement, and social well-being. To be considered a developed country, India needs to achieve high per capita income, excellent infrastructure, diverse and sophisticated industrial base, and a high standard of living. The Viksit Bharat vision encompasses guiding the country through technological advancement, robust governance, environmental sustainability, and socioeconomic improvements. The essence of Viksit Bharat lies in fostering an inclusive society where every citizen has access to opportunities for personal and professional development. In this article, we elaborate on the virtuous cycle model of macroeconomic factors for the Indian economy to achieve the goal of Viksit Bharat 2047.
1. Background
In its report on the 2018-19 round of the Economic Survey, the Ministry of Finance of the Government of India (2019) has emphasized on the term virtuous cycle. The concept of the “virtuous cycle" has been explored across various disciplines, including business, marketing, economics, urban ecology, water resource management, and social psychology. The Merriam-Webster Dictionary defines a virtuous cycle as “a chain of events in which one desirable occurrence leads to another which further promotes the first occurrence and so on resulting in a continuous process of improvement”. In other words, it is a self-propelling feedback loop of positive actions and outcomes reinforcing more positive actions and outcomes. In terms of an economy, growth in one sector fosters growth in other areas thus creating a cycle that benefits the entire economy.
The report the of Ministry of Finance of the Government of India (2019) makes a fundamental departure from the traditional economic view by postulating that the economy is never in equilibrium but in either a virtuous cycle or a vicious cycle. Drawing upon the empirical evidence available regarding sustained high economic growth achieved in many eastern Asian countries, the report notes the importance of creating and sustaining a virtuous cycle for achieving the goal of becoming a US$ 5 trillion economy by 2024-25. Accordingly, a virtuous cycle of investments, savings, and exports can propel the Indian economy/GDP to US$ 5 trillion by maintaining a growth rate of 8 percent. For India, private investment would be the key variable driving this virtuous cycle.
The per capita GDP of the eastern Asian countries for the years 1960-2023 is presented in Figure 1 along with that of India’s. The per capita GDP is measured in constant 2015 US$ values. India and Singapore have the lowest and the highest per capita GDP respectively among these countries. China has the second lowest per capita GDP though the difference between India and China has increased tremendously particularly after the early 2000s. For India to achieve the status of a developed economy, therefore, a likely growth strategy would be to follow the eastern Asian model. However, the choice of the growth model should be based on India’s situation.
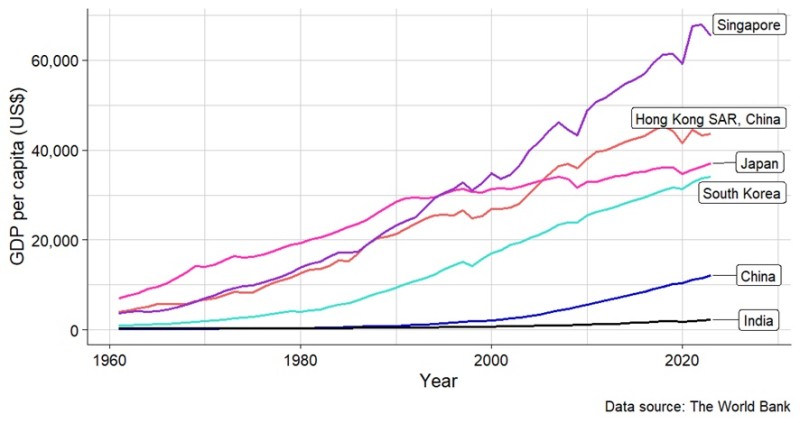
Figure 1. Per capita GDP of the major East Asian economies and India: 1961-2023.
2. The choice of appropriate economic growth strategies for India
The question as to why different countries grow at different rates is probably the most important one in economics (Baumol and Blinder 2011, p517). The growth policy for an economy should ensure a sustained high growth rate of potential GDP. There are three principal strategies for growth in an economy: export-led growth; consumption-led growth; and, investment-led growth. The three growth strategies can be understood using the basic equation for calculating the GDP. The GDP can be calculated from an expenditure point of view as in equation (1) below:
Y=C+I+G+(X-M) (1)
where Y is the GDP expressed as a sum of consumption (C), investment (I), government expenditures (G) and (X - M) representing the net exports as the difference between the exports X and imports M. The GDP can also be expressed in terms of savings as in equation (2) below:
Y=C+S+T (2)
where S is the household savings and T is the revenue earned by the government. By setting equations (1) and (2) equal, we get the following:
S+T=I+G+(X-M) (3)
Rearranging the terms, we get the triple deficit form of the equation as follows:
(S-I)=(G-T)+(X-M) (4)
where (S-I) is the gap between savings and investment, (G-T) is the fiscal deficit, and (X-M) is the trade deficit or the balance of trade. The government efforts that attempt to improve the (X-M) gap can be termed the export-led growth approach. Policies aimed at improving the (S-I) gap are examples of the investment-led growth model. Finally, when the government tries to improve the demand through higher exports and higher incomes driven by higher consumption, it is the consumption-led growth model. These factors need to be explored in detail to understand the optimal growth policy.
2.1 Export-led growth strategy
Exports were recognized as a key source of economic growth from the 1970s onwards (Mohanty 2012). Export-led growth (ELG) refers to a model where a significant portion of a country's GDP growth, job creation, and income increases stems from exporting goods and services. Export orientation of production is also known to induce adoption of efficient technologies that can meet quality standards. The spillover effects of technology adoption is expected to be felt across the economy. Countries such as Japan, South Korea and Taiwan adopted export-oriented strategies during the 1960s and 1970s, leading to significant economic transformations and rapid industrialization. The success of these East Asian economies provided a model for other nations, encouraging a broader adoption of ELG strategies across various regions, including Latin America and Africa. There are some challenges in export-led growth strategies too such as exposure to risks from transmission of global shocks due to increased connectedness to the international markets. The eastern Asian economies experienced such shocks during the Asian Financial Crisis in the late 1990s. The ELG strategy is also prone to protectionist responses from importing countries.
Figure 2 shows the scatterplot of the relationship between a country’s GDP per capita (x-axis) and its exports expressed as a share of its GDP (y-axis) for selected countries. The plot also shows the best fitting regression line for this relationship estimated using the ordinary least squares linear regression. For all the countries, there is a positive relationship between per capita income and exports, i.e., as one variable increases the other variable also increases. The figure also shows that for Singapore and Hong Kong, exports are larger than their respective GDPs because of the value-added component and also due to their role as centers of reexport.
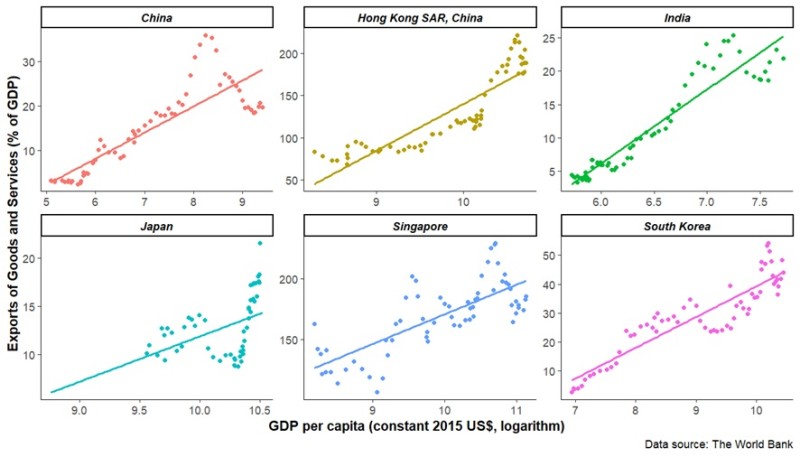
Figure 2. Relationship between GDP and Exports for selected countries over the 1970-2022 period.
2.2 Consumption-led growth strategy
Increased consumption in an economy would create higher demand and higher output thus leading to higher growth. Keynes proposed the consumption function as the relationship between disposable income (Y) and consumption (C) such that C=α+βY where α is the consumption when income is zero or the autonomous consumption, and βY is the induced consumption that varies with the income level of the economy. The intercept of the linear consumption is given by α and its slope is given by β as shown in Figure 3. Since income is determined by taxation, consumption can increase when tax rates are reduced by the government.
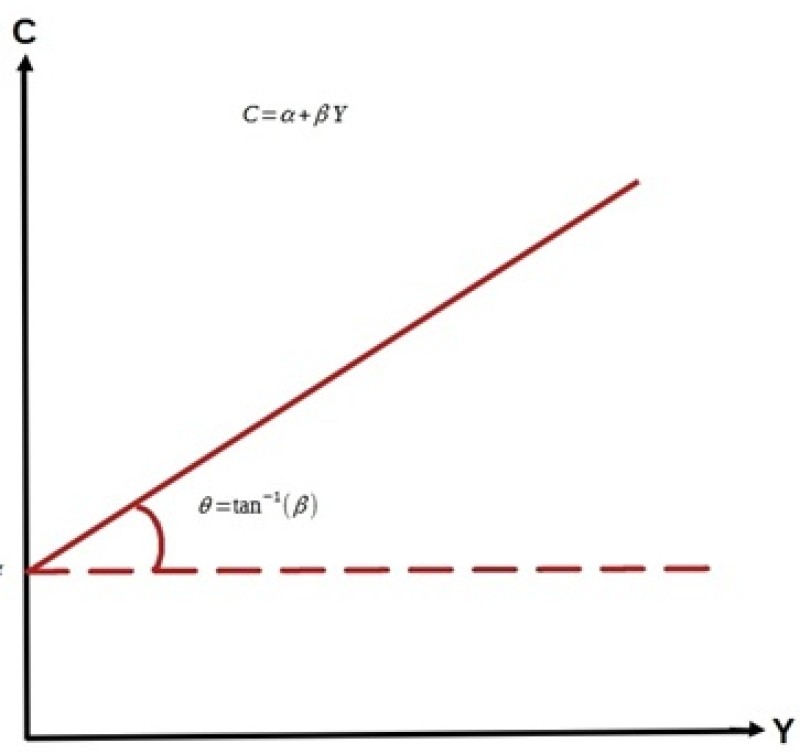
Figure 3. Graphical representation of the consumption function.
Figure 4 shows the relationship between per capita GDP (in logarithms) and savings for selected countries over the 1970-2022 period. There is a clear positive association between GDP and savings.
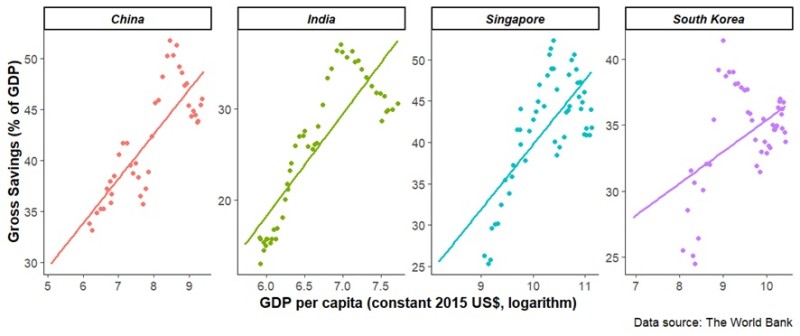
Figure 4. Relationship between GDP and Gross Savings for selected countries over the 1970-2022 period. Note: Japan and Hong Kong data had excessive missing observations and hence were not plotted.
2.3 Investment-led growth strategy
Increase in capital stock can be achieved through investments by the governments or private businesses. Investments that add to the stock of existing infrastructure, equipment, or software would lead to capital formation. In India, the recent high growth rate of GDP is partly attributed to the investments by the government in the form of capital expenditure (capex). Public capex has increased to about 3.4 percent of GDP compared to 1.7 percent in 2019-20. The public capex spending is expected to kickstart private investments through technical change/improvement, creation of capacity, increased productivity, improved profitability especially for the MSME sector that contributes about 50 percent to our exports, and also through increased jobs and income levels. Similarly, increased private investments would stimulate aggregate demand, increasing the output and creating export possibilities.
Figure 5 shows that the private capital formation trends closely follow the gross capital formation. However, Kumar and Srinivasan (2024) argue that this virtuous cycle led by public capex has broken recently, and India’s private sector has not been very enthusiastic in responding to the government’s call for increased investments. The sluggish response of the private sector could be due to the moderate growth in final consumption. In fact, the 4% growth in private final consumption expenditure is the weakest since 2002-03 excluding the period of COVID-19 impact in 2020-21. Weak prospects for consumer demand growth may be hindering the private sector from investing in capital.
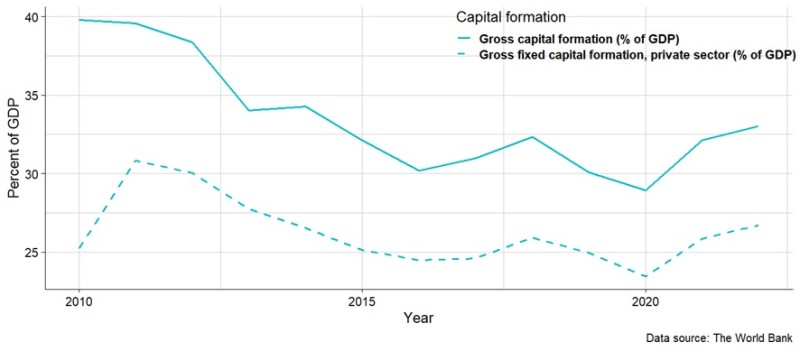
Figure 5. Capital formation in India: 2010-2022.
Figure 6 shows the scatterplot of the relationship between a country’s GDP per capita (x-axis) and its investments approximated by the Gross Capital Formation (GCF) as a share of its GDP (y-axis) for selected countries. The scale for the y-axis for each country is different. Except for Hong Kong, there is a positive association between GDP and Gross Capital Formation for the other countries. Thus, as one variable increases the other too increases. The association appears to be quite strong particularly in China where the investments (i.e., GCF) are high compared to other countries. Hong Kong appears to have the lowest share of GCF in the GDP going by the scale on the y-axis.

Figure 6. Relationship between GDP and Gross Capital Formation for selected countries over the 1970-2022 period. Note: India and Japan data had excessive missing observations and hence were not plotted.
3. The path forward for India
The Indian economy needs to grow at a sustained rate of at least 9 percent over the years to become a developed economy by 2047. The per capita income needs to grow by 7.5 percent during the same period to reach the level of US$ 13,205 from the current US$ 2,500. The experience of the eastern Asian economies indicates that a virtuous cycle of investments, savings, and exports is needed for catalyzing the growth of India’s GDP. Private investment would play a crucial role in achieving this goal. The government has several policy instruments that can be used to attract private investments. Some of these include tax provisions on capital gains, lowering of real interest rates so that businesses can borrow at lower rates, create a more conducive environment for technological progress and entrepreneurship, ensure property rights, and maintain policy stability. The manufacturing sector, especially the MSMEs, needs to be encouraged.
It is indeed a hard task to take a large country like India from being a lower-middle income country to a high income country. A major contribution towards this goal can come from reorienting the country’s economy towards manufacturing. Advanced economies are characterized by a lower share of agriculture in the GDP and higher shares of the manufacturing and the services sector (Table 1). Though the services sector has tremendously increased its share in India’s GDP since liberalization in 1991, the performance of the manufacturing sector is underwhelming. The typical trajectory for a largely agrarian country in transforming into an advanced economy is to first improve the manufacturing sector and then concentrate on the services sector. Thus, India bypassed a key step in this developmental trajectory after the liberalization. Without a vibrant manufacturing sector, the potential of the services sector in contributing to the economy is diminished. Hence, India should give utmost importance to emphasize improving its manufacturing capabilities.
Table 1. Contribution of agriculture, industries, and services in the GDP and workforce for India, US, and Germany.
Sector | Share in GDP (percentage) | Share in workforce (percentage) | ||||
India | USA | Germany | India | USA | Germany | |
Agriculture | 18.42 | 0.9 | 0.9 | 43.96 | 1.66 | 1.25 |
Industries | 28.25 | 18.9 | 29.1 | 23.93 | 19.18 | 27.62 |
Services | 53.33 | 80.2 | 70 | 30.7 | 79.15 | 71.12 |
The Government of India is attempting to correct for this missed opportunity in manufacturing and has come up with initiatives such as the Production-linked Incentives (PLI) program to promote the manufacturing sector. Given that the ability of India’s economy to generate employment opportunities is on a decline (Rao, 2024), it is necessary to encourage the formal sector for meaningful employment. While as of now the small and micro enterprises account for about three-fourths of the manufacturing labor force, there is a great need to promote labor-intensive manufacturing for employment generation and for formalization of the economy. Given the rising population, such push towards formal economy would be necessary to keep the social stability too. India should utilize its demographic advantage to attract more investments as many multinational companies are adopting a “China plus one” strategy to diversify their supply channel and to overcome the increasing costs of doing business in China and its geopolitical isolation (Bhattacharjea 2022). India should identify specific industries (such as pharmaceuticals, textiles, electronics, automobiles, technology services etc.) in which it can become globally competitive and support such industries through investments and subsidies.
A key factor to consider when moving away from agriculture and towards the manufacturing sector is the quality of workforce. Labor quality is one of the key pillars of productivity growth, and productivity growth is the key driver of GDP growth (Baumol and Blinder 2011, p520-525). Skilled and educated laborers are more productive than uneducated and untrained laborers. Thus, the government should prioritize education and human capital improvement as key drivers of growth. In terms of education, India has indeed achieved a lot as evidenced by the higher Gross Enrollment Ratio (GER) in higher education. The GER is the ratio of total enrolments of people aged 19-23 in higher education to the total population in that age group. Higher GER indicates higher enrolment. From a higher education GER of about 3 percent in 1960-61, India achieved a GER of 28.4 percent in 2021-22 (AISHE 2024). However, qualitatively, the number of students who study in 3-year traditional undergraduate degree programs is substantially higher than those studying in technical courses. The three-year degree programs do not offer the skills required in the job market and their graduates find it difficult to find employment in the formal labor market.
Given that technical education programs such as engineering and medical sciences are mostly run by private institutions and are generally expensive, a recent development has been the increased enrolments in diploma programs. Such trends can create the workforce needed for a manufacturing-driven economic growth and hence need to be promoted. India must achieve a GER of 50 percent by 2030 and from there aim for universalization of higher education with more emphasis on technical education. Even so, the quality of education in these institutions needs improvement. Such educational interventions need to take care of the needs of the female students since a key feature of the labor markets of advanced economies is the greater participation of women in the workforce. For example, in the US, about three-fourths of all women in the age groups of 25 to 54 years participate in the labor market. On average, female labor force participation rate in the US is about 57 percent, UK 58 percent, Australia 62 percent, China 61 percent, Japan 55 percent, and Korea 73 percent, For India, the female labor force participation has increased to 37 percent.
Thus, the potential of female workers needs to be harnessed by empowering them with proper skills and education to accelerate the economic growth and make the growth more inclusive.